Market Perspective for December 4, 2015

Stocks vacillated at the end of the week in response to central banks. The European Central Bank (ECB) disappointed investors on Thursday, igniting the most dramatic selloff since September. The central bank’s policy initiatives were deemed insufficient, merely meeting the expectations priced into the market. Although the ECB cut its deposit rate into deeper negative territory and extended its asset purchase program for another six months as expected, many investors had anticipated a larger stimulus package.

The move was completely reversed on Friday as the much-anticipated November non-farm payroll report exceeded expectations. Federal Reserve Chair Janet Yellen spoke on several occasions this week, asserting  the Fed’s confidence in the economy and stating the Fed was on pace to raise interest rates at its December meeting, data permitting. Fed Chair Yellen’s economic threshold for the workforce was 100,000 jobs per month, based on labor participation rates and an aging population. The U.S. jobs report blew that number away, with the creation of 211,000 jobs, 11,000 more than expected. Additionally, the unemployment rate remained at a stable 5 percent and jobs data for September and October was revised higher.

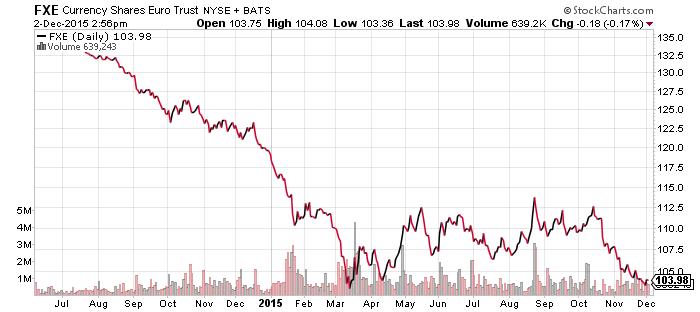
Jobs data hardened December rate hike expectations, raising futures odds up to 79 percent. Strong U.S. economic data failed to impact the euro, cornering ECB President Mario Draghi into commitments for further easing. With the U.S. set to tighten liquidity, the ECB will have to pick up the slack. Although stocks were up strongly from the open on jobs data, Draghi’s comments added a renewed bullish push.

Technology, healthcare and consumer discretionary stocks led the market higher, while energy continued to struggle. Even rate sensitive utilities managed to climb more than 1 percent on Friday, but energy declined after OPEC’s decision to leave production unchanged in spite of Iran’s intention to increase production. This news sent oil slightly below $40 per barrel, but prices rebounded back to around $40 by the end of the day.

The Institute for Supply Management reported earlier in the week that its index of non-manufacturing activity was 55.9, below expectations of 58.0. The ISM Manufacturing index came in at 48.6 versus an expected 50.5, though the Markit PMI was higher at 52.8. The two surveys use similar data points, but weight them differently. Readings above 50 on either scale indicates expansion, while under 50 signals contraction. The weak ISM number is a concern as manufacturing is an important economic gauge, but a trend cannot be discerned from a one month blip in the data. Pending home sales for October ticked up 0.2 percent, and construction spending, a leading indicator for the market, was much higher than expected, up 1.0 percent in October.

ETF Watchlist for December 3, 2015

WisdomTree Chinese Yuan (CYB)
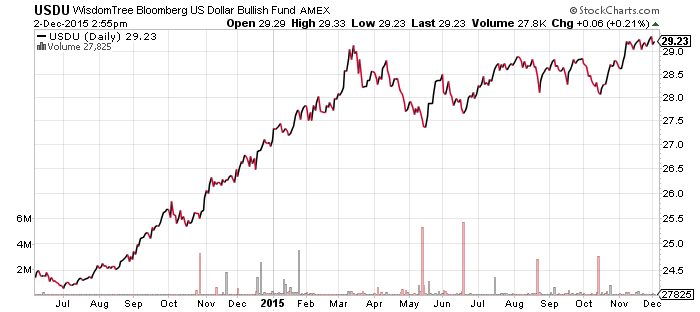
WisdomTree Bloomberg USD Bullish (USDU)
CurrencyShares Euro Trust (FXE)
CurrencyShares Swiss Franc (FXF)
CurrencyShares Swedish Krona (FXS)
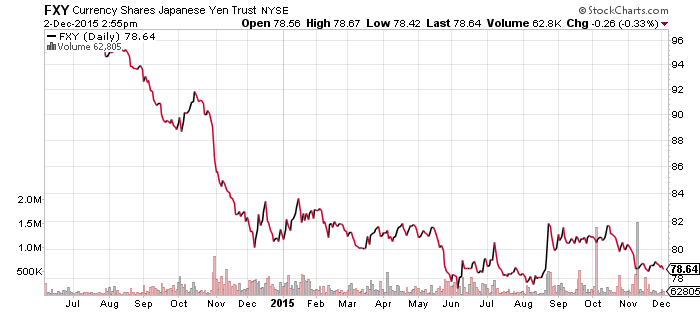
CurrencyShares Japanese Yen (FXY)
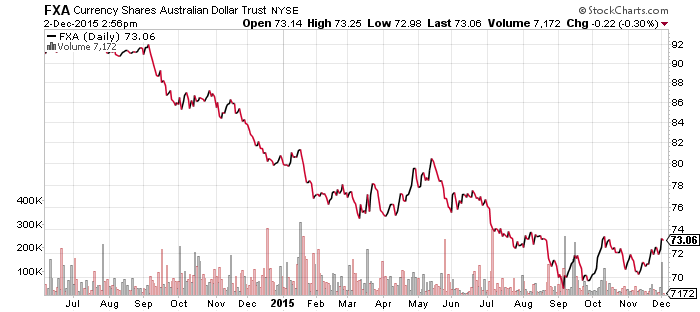
CurrencyShares Australian Dollar (FXA)
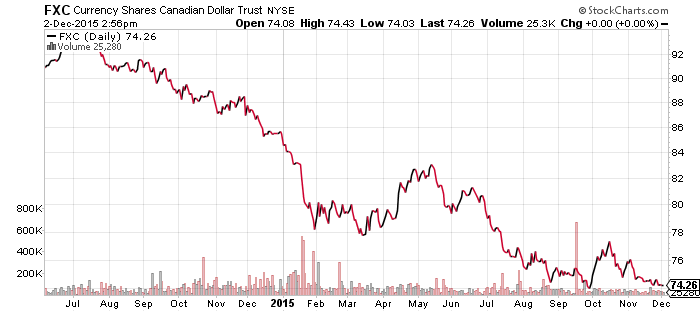
CurrencyShares Canadian Dollar (FXC)
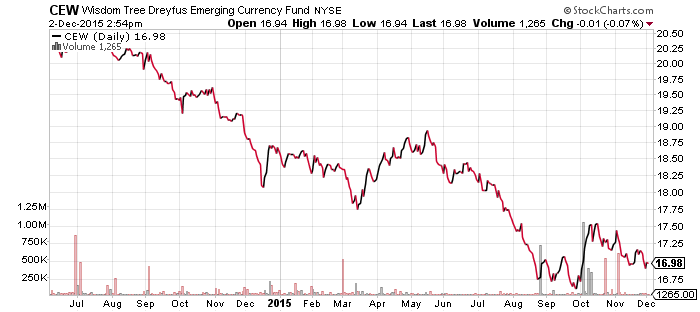
WisdomTree Emerging Market Currency (CEW)
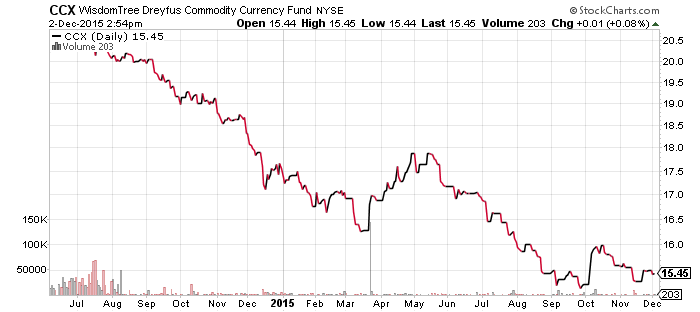
WisdomTree Commodity Currency (CCX)
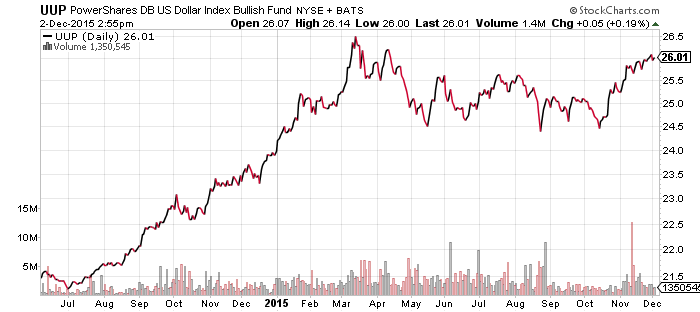
PowerShares DB U.S. Dollar Bullish Index (UUP)
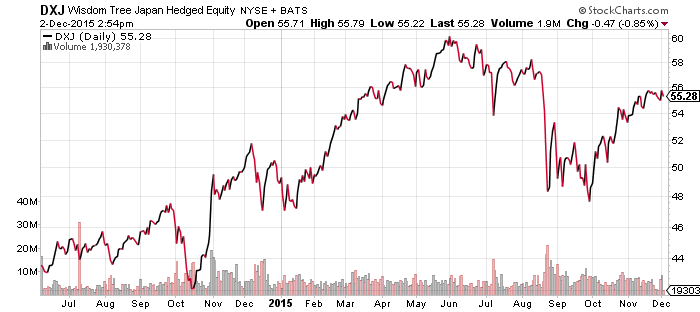
WisdomTree Japan Hedged Equity (DXJ)
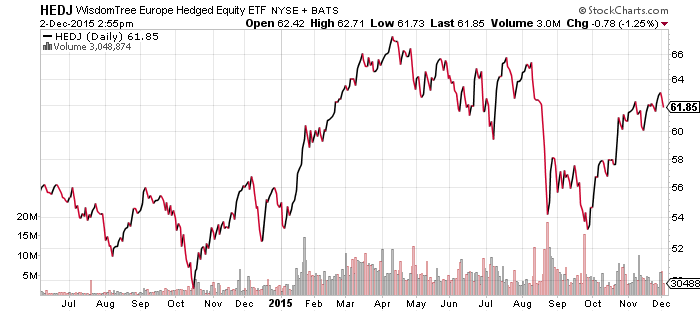
WisdomTree Europe Hedged Equity (HEDJ)

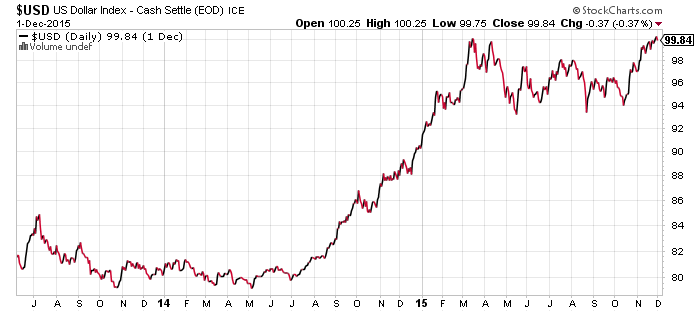
Janet Yellen’s public comments Tuesday sent the dollar higher. She raised the point, voiced last month by other Fed officials, that a hike in interest rates will be a signal of confidence in the economy. Nevertheless, upon the disappointment of the failure of the European Central Bank to deliver enough stimulus to assist in faster growth, the green back has shown signs of exhaustion and we may see a pullback over the very short-term.

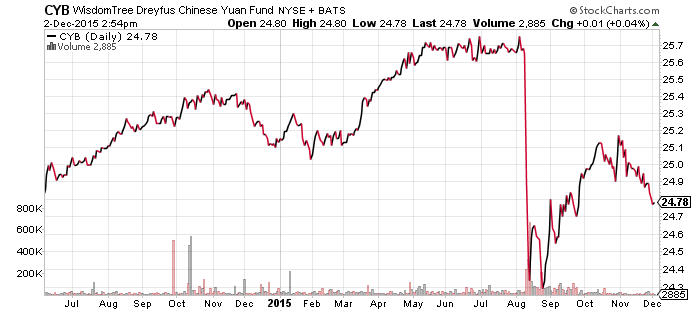
China’s yuan was added to the IMF’s SDR basket on Monday as expected, leading to an immediate drop in the yuan. Officials in China deny any concern for further weakness in the yuan, but the market remains bearish on the currency versus the U.S. dollar.

Canada’s loonie failed to break to a 52-week low in the past week, despite negative economic data that elicited a brief drop in the currency. September GDP was down 0.5 percent month-over-month, the worst monthly figure in 6 years, but GDP grew 2.3 percent for the quarter, the best of 2015 thus far. The Australia dollar has been rallying versus the greenback as well. The Swedish krona, like the loonie, is showing strong resistance to pushing below its 52-week lows. The Swiss franc has been an exception.

Overall, these funds comprise key support/resistance levels for multiple currencies. The length of time is significant, for instance FXS has triple-bottomed over eight months.


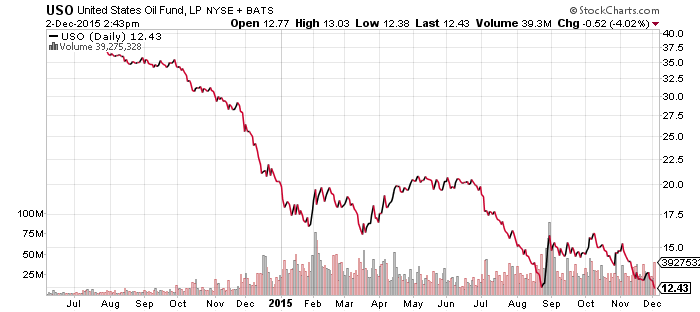
United States Oil (USO)
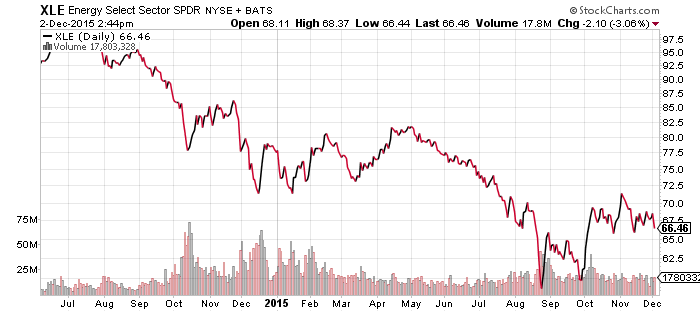
SPDR Energy (XLE)
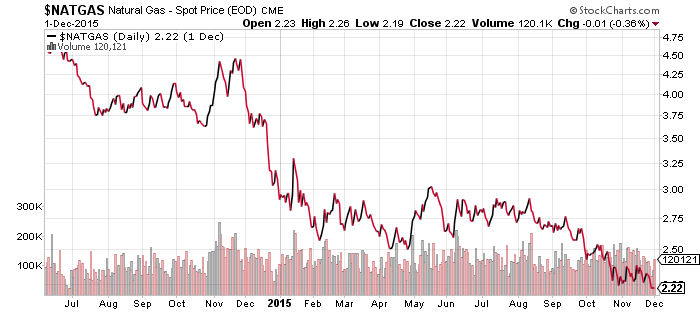
FirstTrust ISE Revere Natural Gas (FCG)
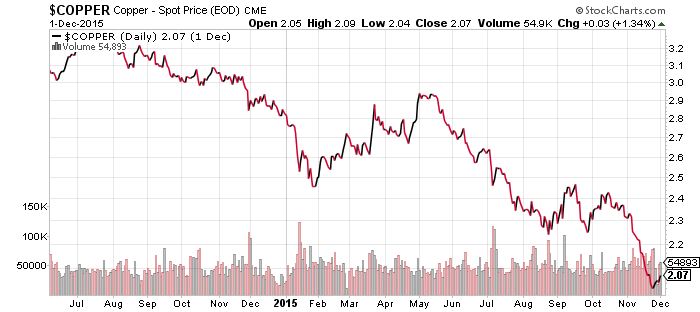
Global X Copper Miners (COPX)
Market Vectors Coal (KOL)
Market Vectors Steel (SLX)

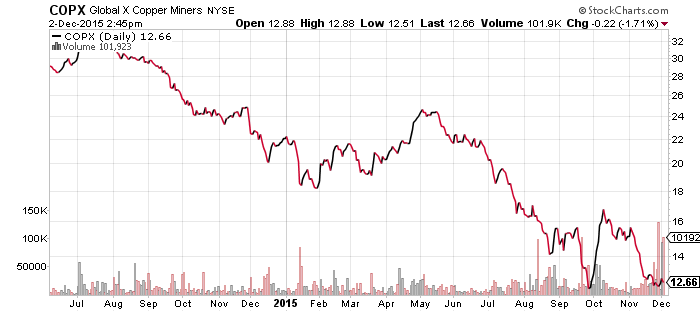
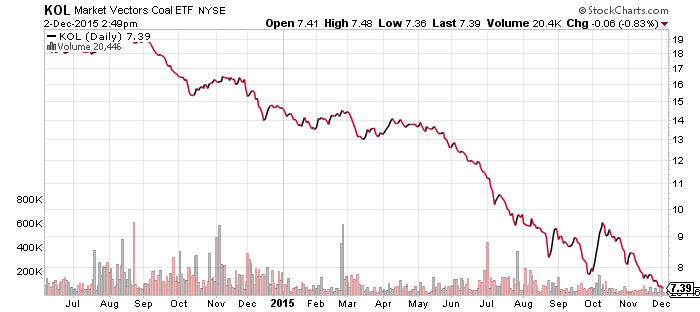
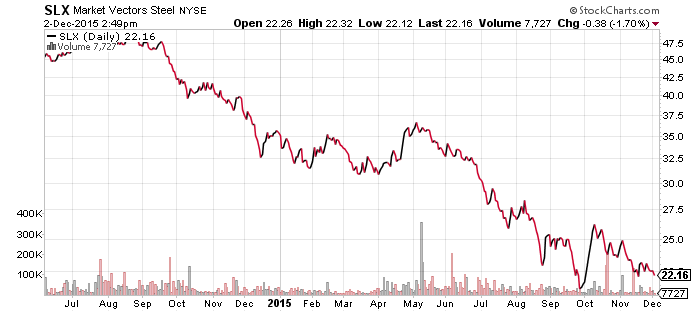
Oil prices spiked on Wednesday when Iran announced a majority of OPEC members were in favor of production cuts. Saudi Arabia and other major oil producers later expressed disagreement, reversing the trend. U.S. production is also strong and inventories are rising, all negative factors for crude. West Texas Intermediate Crude, the main price for U.S. oil, is still off its lows of the year, Brent crude, which is a more important indicator for Europe, is very close to its lows in 2015 and could make a new closing low today.

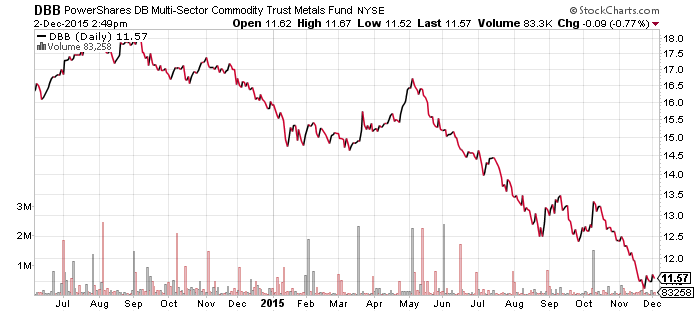
Other commodities rebounded last week, led by a bounce in copper, but equity investors didn’t buy the uptick.


iShares MSCI Emerging Markets (EEM)

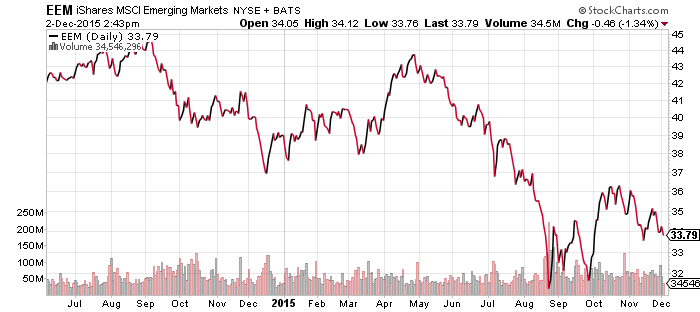
EEM is right at $34 a share, the midpoint between the recent high of $36 and low of $32. Those are the key levels in the near term. Short-term technical indicators such as relative strength are neutral.

SPDR Utilities (XLU)
SPDR Pharmaceuticals (XPH)
SPDR Materials (XLB)
SPDR Consumer Staples (XLP)
SPDR Consumer Discretionary (XLY)
SPDR Healthcare (XLV)
SPDR Technology (XLK)
SPDR Financials (XLF)

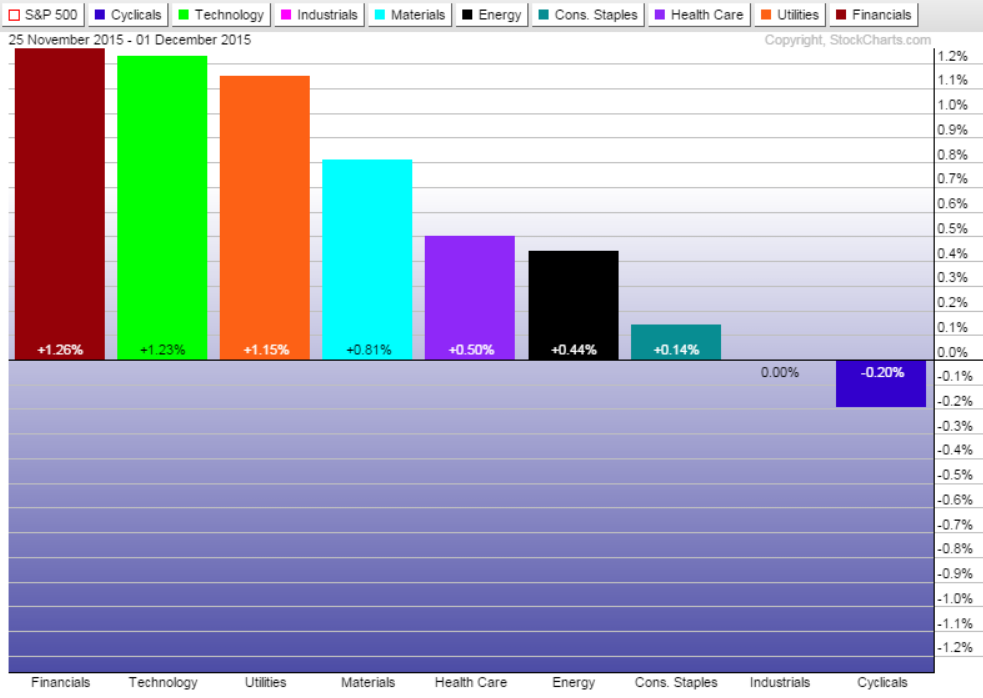
Financials and utilities were surprise winners in the past week. Rate hike expectations fueled the rise in financials. Utilities typically underperform when rates tick up, but they had a decent week as most of the market moved higher.

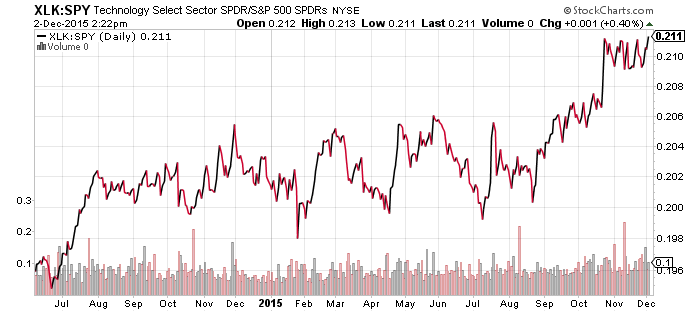
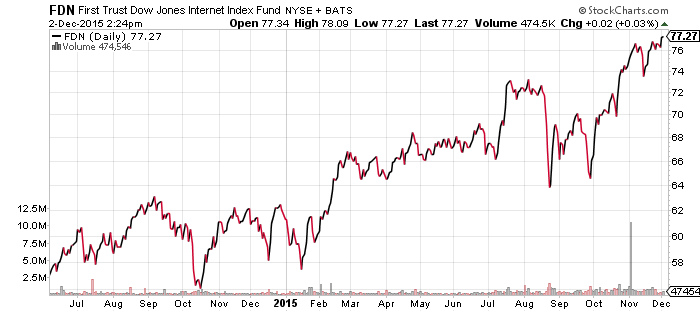
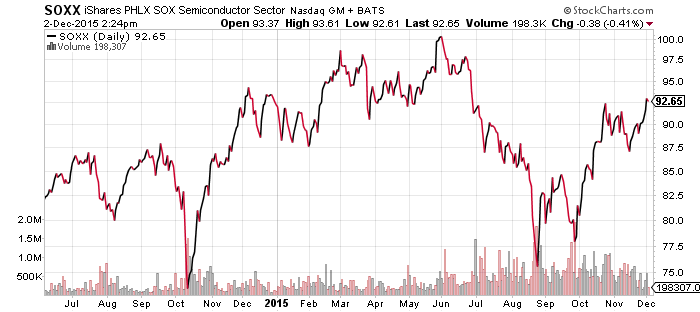
Technology is showing the most strength relative to the broader market in the past week. The price ratio of XLK to SPDR S&P 500 (SPY) is breaking out to a new 52-week high. Internet shares continue to push into record high territory, while subsectors such as semiconductors have also performed well in recent weeks.


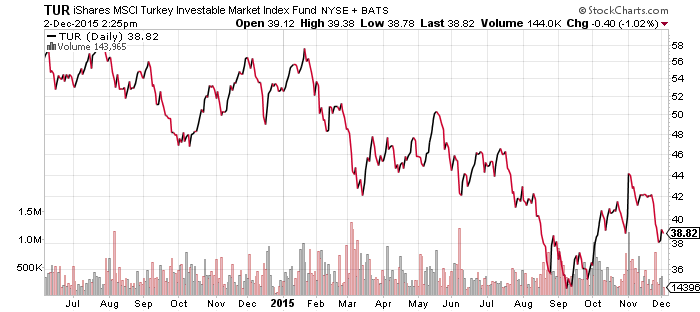
iShares MSCI Turkey (TUR)

Turkey fell last week after the country shot down a Russian jet under questionable circumstances. Tensions with Russia have heightened, but the overall trend in TUR was bearish to begin with. The long-term trend will establish itself here whether tensions dissipate or intensify.

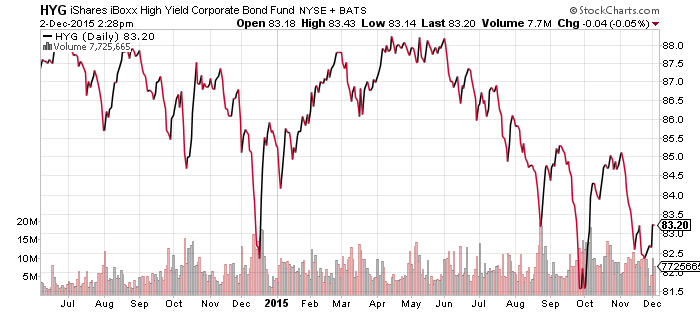
iShares iBoxx High Yield Corporate Bond (HYG)
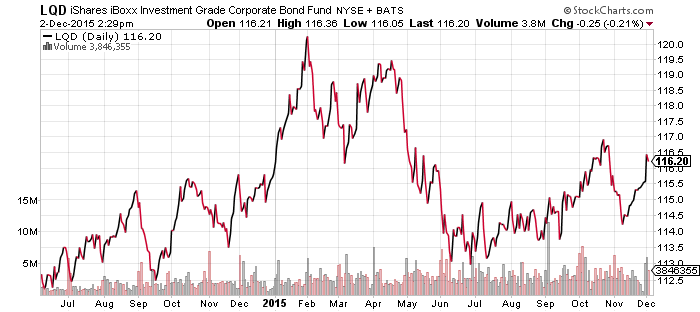
iShares iBoxx Investment Grade Corporate Bond (LQD)

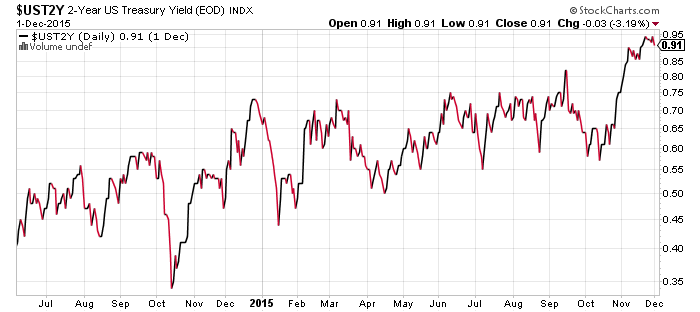
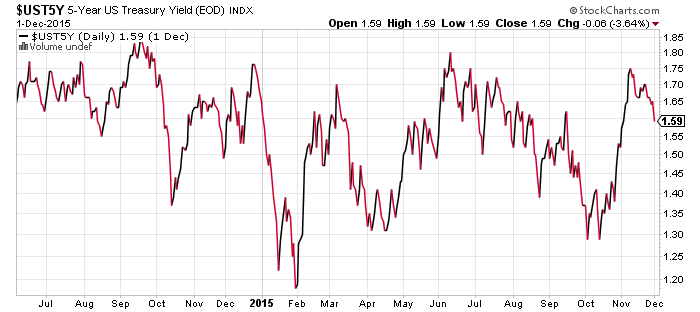
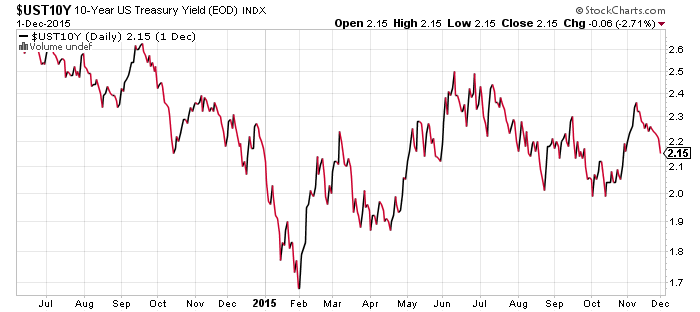
Both HYG and LQD benefited from a drop in interest rates over the past couple of days. The big move came on Tuesday when the ISM PMI fell below 50 for November. Although the Markit PMI was still above 50, speculators bet the Fed would not hike rates due to that number. Hawkish comments from Yellen yesterday have rates moving higher. As the charts show, the dip in rates was larger at the long-end, but the short-end is most impacted by a Fed hike.


SPDR S&P 500 (SPY)
iShares Russell 2000 (IWM)
S&P Midcap 400 (MDY)
SPDR DJIA (DIA)
PowerShares QQQ (QQQ)
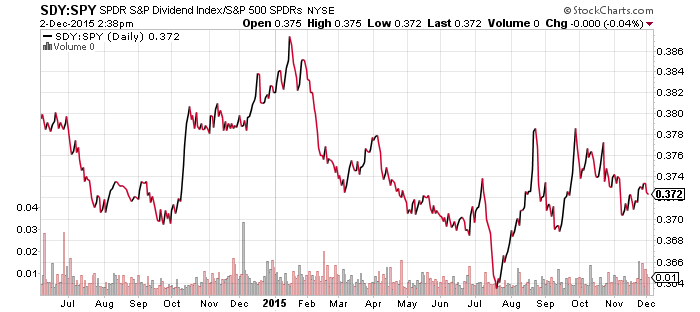
SPDR S&P Dividend (SDY)

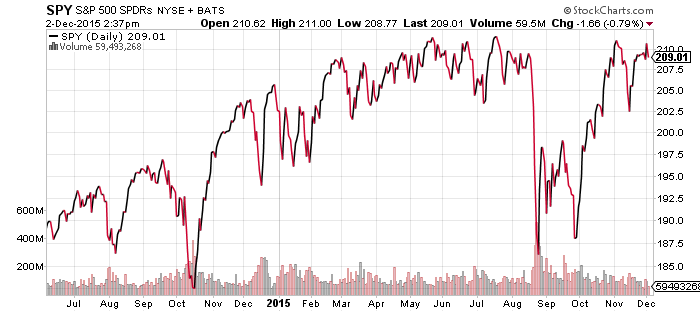
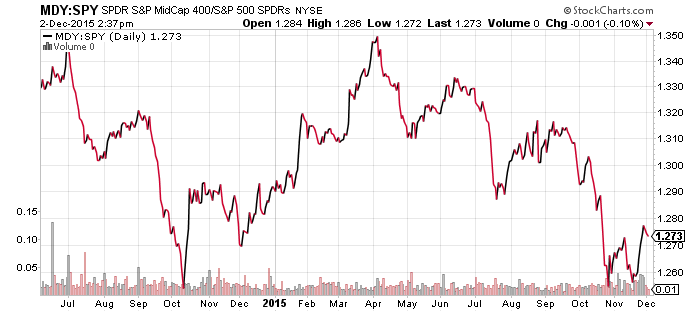
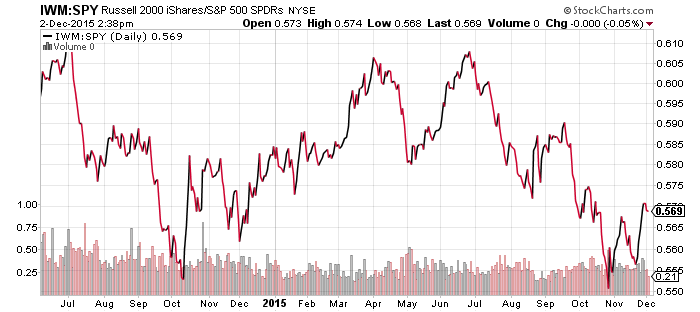
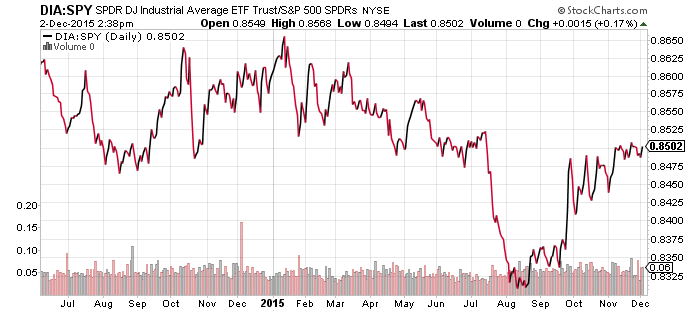
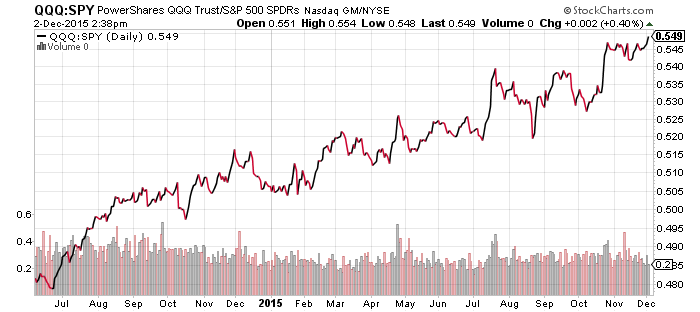
Mid- and small-cap shares enjoyed another bounce in the past week as the U.S. Dollar Index climbed above 100. The tech heavy QQQ broke out to a new relative high versus the S&P 500 Index, similar to the breakout in XLK. The Dow continues to perform well. Relative to the S&P 500, the Dow is overweight consumer discretionary which is near its highs for the year having set a new 52-week high in November.