Click Here for the June 23, 2014 issue of the Global Momentum Guide. Weekly Sector Perspective The Russell 2000 Index led the major indexes we track with a 2.21 percent return. Conversely, […]
Month: June 2014
Market Perspective for June 20, 2014
The S&P 500 looks to close the week at yet another record high. Stocks were certainly helped by the positive comments made by the Federal Reserve regarding the economy. The Fed continued to cut bond purchases by another $10 billion, indicating they see the economy improving. Additionally, nearly all of the economic data this week met or beat expectations. These reports included capacity utilization, CPI, and home builders’ index.
Inflation looks to reemerge, which from the Fed’s perspective, is good news. The U.S. needs to have high nominal GDP growth (real GDP plus inflation) in order to grow out of the budget deficit and reduce the nation’s overall debt levels. With inflation of 2% and real growth of 2-3%, the U.S. could grow nominal GDP at 4-5% annually and slowly bring the deficit under control.
Inflation increased at a nearly 5% annualized rate in May. The core number the Fed prefers, which strips out energy and food, was up an annualized 3.6%. One month’s number doesn’t make a trend, but as we mentioned in yesterday’s ETF Watchlist, data from MIT’s Billion Price Project suggests these numbers will stay at this level for several months. For this reason, some investors are worried about the ramifications of increased inflation.
Over the past 10 days, energy and utilities have significantly outperformed the broader market. The Energy Select Sector SPDR (XLE) is up more than 3%, while Utilities SPDR (XLU) is up more than 2%. During the same period, SPDR S&P 500 (SPY) is up less than 1%. It had looked as though utilities would lose ground as the best performing sector in 2014. However, utilities broke out to a new high on the same day as the Fed’s announcement and energy has also steadily moved upward. It appears that investors are starting to price in higher inflation.
One reason why we have recommended energy and utilities this year is because they typically begin to outperform in the middle of a bull market cycle. During the initial phase of a recovery, slack demand first needs to increase. Only by the middle of a recovery do we start to see inflation pick up as commodity producers fall behind demand. Due to the weak recovery (2% annualized GDP growth almost every year since 2008) and huge increase in U.S. energy production, has kept prices low. We may only now be reaching the middle of an economic expansion cycle when demand pushes up energy prices. If so, the bull market still has several years to run.
One important indicator for utilities will be interest rates: utilities moved higher as interest rates (the 10-year Treasury rate) stayed low on the week. Utilities performed poorly when rates increased in 2013; if inflation remains elevated and economic growth stays strong, higher rates are very likely.
ETF Watchlist for June 19, 2014
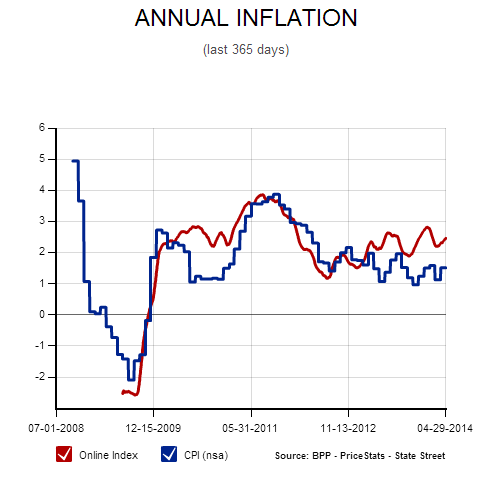
Below is the annual inflation rate as measured by MIT’s Billion Price Project which records the changes in billions of prices online. The chart shows that currently, BPP has inflation running at nearly 2.5 percent annually, above the government’s official Consumer Price Index (CPI) number. In 2010 there was a similar gap, which eventually closed in favor of the BPP number.
The BPP indicates more upward surprises like we saw this week, when the core CPI number came in higher than expected at 2 percent. The core number strips out energy and food, which are volatile month to month, but the increase in the CPI for May and BPP’s number are telling us inflation has spread from food and energy to the entire economy. General inflation may be coming back.
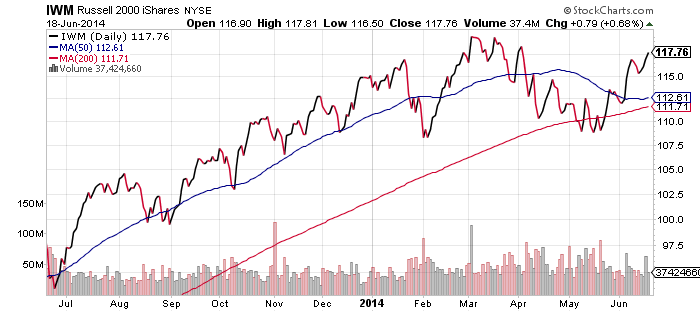
iShares Russell 2000 (IWM)
Should the Nasdaq achieve a small advance today, the Russell 2000 Index will be the only remaining major index below its all-time high. The index is likely to move higher, and if it gains a bit more than 2 percent, it will hit a new high and send bears scrambling. In other words, if the bullish action continues over the coming week, IWM could outperform the other indexes as shorts cover.
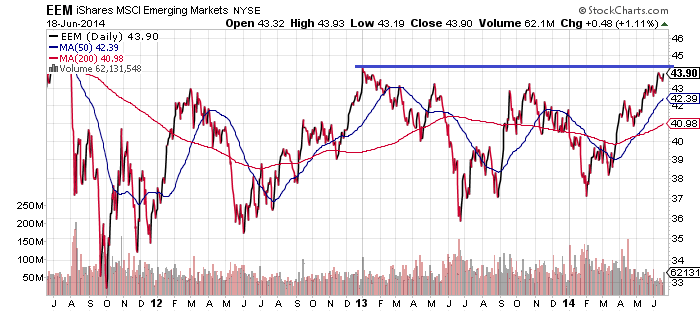
iShares MSCI Emerging Markets (EEM)
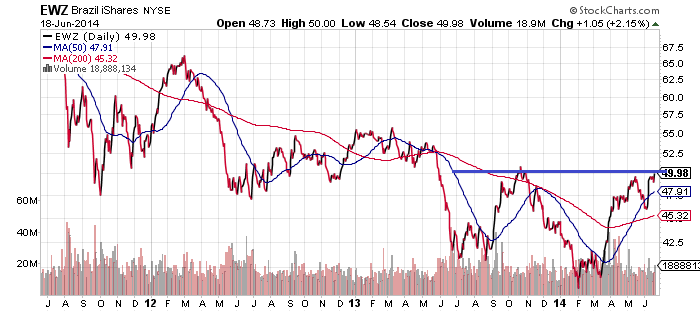
EEM is at a major resistance line and several individual country funds have similar charts. See Brazil (EWZ) below as an example. Yesterday’s Fed announcement caused a drop in the dollar and a rally in emerging markets, with EEM and EWZ both pushing up to their resistance lines again.
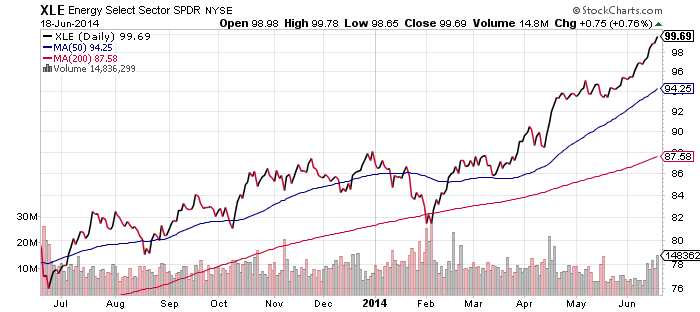
SPDR Energy (XLE)
Events in Iraq sent oil prices sharply higher at the end of last week. The S&P 500 Index is up slightly over the past 5 trading days, but energy ETFs have witnessed far larger gains. XLE added more than 2 percent, while SPDR Oil & Gas Exploration & Production (XOP) and First Trust ISE-Revere Natural Gas (FCG) both rallied more than 4 percent. We were looking for energy to be a potential market leader earlier this year. Thanks to inflation picking up, in addition to solid economic growth, it looks set to perform well going forward.
ETF Investor Guide: June 2014
Click here to read the June ETF Investor Guide Market Perspective: Expect More Volatility As Markets Continue Rally It was an excellent month for the stock market, with the S&P 500 Index climbing […]
ETF Investor Guide Market Perspective: Expect More Volatility As Markets Continue Rally
It was an excellent month for the stock market, with the S&P 500 Index climbing 3.49 percent and the Nasdaq climbing just shy of 6 percent on the month. The […]