Market Update for February 24, 2014

Troubles in the Chinese real estate market are back and banks have reduced lending to the property sector, at the same time that many trusts are coming due. There were reports over the weekend of developers slashing prices on new homes in order to move inventory. Putting the stories together, it could mean developers are facing a cash crunch and may be forced to liquidate property. With trusts coming due, however, a decline in home prices would not be good news. The risk of a major financial crisis is ever present in China due to the huge buildup of debt.

For that reason, the Shanghai Composite was down more than 2.5 percent in morning trading before recovering to a loss of 1.75 percent on the day. European markets didn’t suffer in early trading, but it can take some time before European and American markets digest the news from China. The Chinese are most sensitive to the news, but if it looks like a more serious trend is underway, Europe and the U.S. markets will head lower.

To get an idea of how large the problem could be, last week the central bank of China allowed the yuan to fall in value. It was the biggest one-week drop since 2011, when fears of a real estate slowdown first became big news, and also marks one of the few reversals during a more than 2 year period of appreciation. That 2011 drop in the yuan was also around the time of the first U.S. debt ceiling debate, when the European debt crisis was in full bloom and when gold peaked above $1900 an ounce. The real estate market didn’t slow down for long though, as developers pushed into smaller cities in order to grow. Now it appears they have overdeveloped these cities as well, and the only solution may be a drop in prices.

The situation warrants concern because China is a significant driver behind global economic growth. Unlike Japan’s crisis in the 1990s, there is no one else to pick up the ball and pull the global economy along if China stumbles. The result of a crisis in China could be a global economic recession that reignites debt problems in Europe and sends the U.S. unemployment rate in the wrong direction. For this reason, it pays to keep an eye on China. They have avoided a major crisis since the early 1990s, when the yuan was devalued by 60 percent, but this is the riskiest situation since 2008 and they will not be able to use another stimulus/lending policy to bail themselves out as they did in 2009.

Economic Reports: This is a light week for economic data. The big story of the week is likely to be Janet Yellen’s Senate testimony on Thursday.

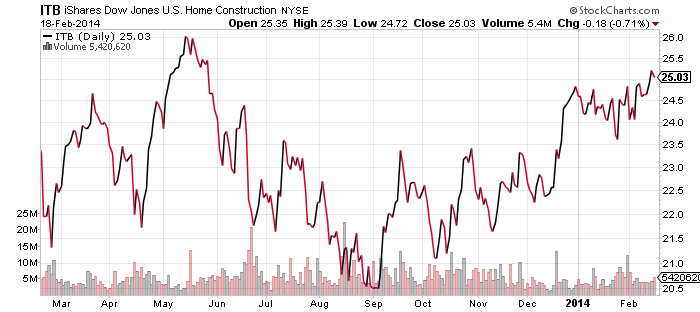
New home sales on Wednesday will be closely watched, but weak housing data in recent weeks was ignored by the home builder stocks, which suggests investors are looking ahead to more favorable data. We’ll see if they get it this week.

On Friday, the most important data point for the week will be out: the revised GDP for the fourth quarter of 2013. Friday will also see the Chicago PMI and University of Michigan consumer sentiment for February, along with pending home sales from January.

Earnings: Earnings season is trailing off, but there are still a number of retailers reporting this week. Home Depot (HD), Macy’s (M), Best Buy (BBY), Lowe’s (LOW) and Target (TGT) are among them.

Market Update For February 21, 2014

U.S. stocks ultimately traded sideways this week after a push higher on Tuesday, a drop on Wednesday and a recovery bounce on Thursday. The Nasdaq remains the stronger of the major indexes, with a small gain coming into Friday. On another positive note, the Russell 2000 hit a new high for the week on Thursday.

Economic data was negative overall for the markets this week. The one bright spot was the U.S. PMI, which climbed to 56.7 and beat expectations of 53.6. A number over 50 signals expansion, which is very good news for our long-term outlook, as manufacturing is a leading index. An upturn or downturn in the manufacturing sector can take more than a year to filter through the economy.

Additionally, the strong manufacturing number is important for the markets as it means the Fed is likely to stay the course on the taper. For that reason, we are placing more weight on that PMI number than on the slew of negative data that came out. The worst number was probably the Chinese flash PMI for February, which shows their manufacturing sector in contraction.

Housing data was weak as well, but that didn’t dent the home builders, which have traded roughly in line with the broader market. Biotechnology and solar pushed higher, but they showed signs of losing steam. Facebook’s (FB) purchase of WhatsApp for $19 billion dented the previously strong social media space, but in general internet funds continued to push higher.

Between the relative strength in the small cap index and the NASDAQ, plus subsector strength in internet, biotech and solar, the overall picture remains bullish. Nevertheless, another small pullback today or next week looks more likely than it did a few days ago.  The momentum pushing the leading sectors higher is slowing, which from a technical standpoint, could indicate some resistance over the short-term.

Finally, gold and silver miners remain among the sectors to watch in 2014. It looked as though we’d get a retrenchment this week when shares dipped on Wednesday, but they came roaring back on Thursday. A healthy pullback on the order of 10 percent would be nice to see (large miners are up about 25 percent so far and junior miners up 40 percent) for those looking to enter the sector.

ETF Watchlist for February 19, 2014

iShares Russell 2000 Index (IWM)

The Russell 2000 Index comes into Wednesday trading at an important technical convergence. When the sell-off began there was a big loss early, on January 24. This left a gap in the chart—when the open on the candlestick chart is far above or below the prior day’s trading range, there is a large open space. Technical traders believe that gaps are often filled, such as when a stock that surges on good news, but will eventually test that level before rising again.

We used this method to call for an expected drop in biotechnology back in December, suggesting that it would dip before rising again, providing bulls a better entry point. It behaved as expected, filling the gap before again moving higher.

1213ibb

The gap in IWM is not as impressive, but it is also below the upper trendline from the market peak in 2000. The Russell 2000 approached this peak in 2007, but subsequently turned lower with the rest of the global equity markets. Recently, the Russell 2000 broke this trendline to the upside on its way to new all-time highs, but it is now fallen off. Bearish traders expect this to provide a great amount of resistance, considering it marked the past two major tops for the stock market.

0214iwm

In conclusion, the behavior of IWM this week will be very important to watch.  A break higher would be very bullish for the index as bears are forced to cover; however, this line could prove very difficult to break. A few more weeks of sideways action makes more sense, or even a renewed sell-off, before the index breaks higher.

iShares U.S. Home Construction (ITB)

Home builder sentiment plunged in February, the worst one-month drop ever recorded since the index started in 1985. It’s also the first time the index has slipped below 50, which is the dividing line between positive and negative sentiment, since May 2013. Despite the report, the homebuilder ETF looks ready to challenge its 52-week high. Ironically, as the chart below shows, that high was set in May 2013, the last time homebuilder sentiment was negative. More important for the sector is interest rates, which have been coming down in 2014.

0214itb

 Market Vectors Solar (KWT)

SPDR S&P Biotechnology (XBI)

Let’s take a quick look at a solar and biotechnology ETF that are underperforming relative to their peers. Both iShares Nasdaq Biotechnology (IBB) and Guggenheim Solar (TAN) have broken out to new highs, but Market Vectors Solar (KWT) and SPDR S&P Biotechnology (XBI) have yet to follow. How these two funds perform over the near future may signal the strength of these new sectors. If KWT and XBI fail to follow, it could imply IBB and TAN are overextended, or that the broader market will indeed turn lower again.

We have often discussed biotechnology and solar as pockets of bullishness in bearish periods this year. Also in that category are Global X Social Media (SOCL) and First Trust DJ Internet (FDN), two funds also at new all-time highs.

0214xbi

0214kwt

Market Vectors Junior Gold Miners (GDXJ)

Is the bear market in gold mining shares over? Maybe. GDXJ is up almost 45 percent in 2014 and still the sentiment on gold mining shares remains negative. There has been some takeover activity which is good news, and many firms have gone through share issuance, asset divestitures and write downs. In other words, there’s some reason to believe the bad news is priced in. Most importantly, the price of gold appears to have found firm support above the $1200 level. Gold miners were priced for disaster at the end of 2013 (relative to the price of gold, mining shares traded below their 2008 lows), and unless gold prices tumble again, disaster will be avoided.

That doesn’t mean a pullback isn’t coming given the rapid run-up in prices.  For that reason, we would not chase performance.  Investors who are long-term bullish on gold should remember GDXJ was a split-adjusted $150 stock in April 2011, when gold was at $1500 an ounce. The high of $1900 looms in investors’ minds, but that price was achieved in a $400, three month run-up from July to September. Today, gold miners are in a better position financially, thanks to the three year bear market. In sum, investors who are bullish on gold and looking to buy mining shares may use any dips as a buying opportunity.

0214gdxj


Investor Guide To Fidelity Funds: February 2014

Investor Guide To Fidelity Funds February 2014 A Note from Matt: We would like to introduce you to the first issue of the Investor Guide to Fidelity Funds. For the past several […]

ETF Investor Guide Model Portfolio Changes

We have made several changes to the ETF Aggressive Sector Portfolio.  Effective February 15th, we sold iShares Health Providers (IYH) and reinvested the proceeds in Fidelity MSCI Healtcare (FHLC).  We still favor the healthcare sector FHLC has greater diversification across healthcare subsectors.  Relative to its peers, it also maintains a very low expense ratio of 0.12 percent.  We also sold half of iShares Consumer Goods (IYK) and reinvested the proceeds equally between Technology Select SPDR (XLK), iShares Industrial (IYJ) and FHLC.