iShares MSCI Emerging Markets (EEM)
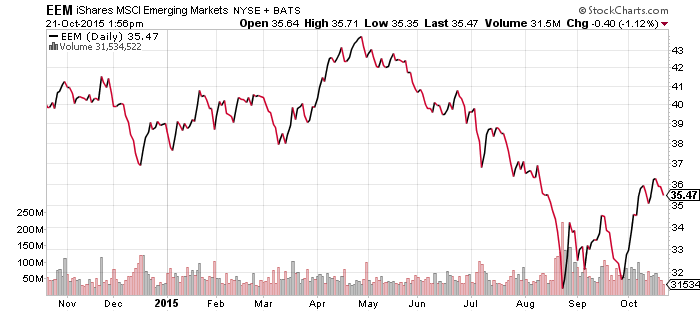
Emerging markets have stalled in the wake of their early October rebound. It could take some time before the outlook turns positive over the long-term for emerging markets from the perspective of the charts, but a short- and even intermediate-term bullish shift is possible. A move above $37 may not hit resistance until it reaches $39, a better than 8 percent move from current levels. A drop of more than 11 percent forces EEM to test its lows. China’s release of economic data this week did nothing to help, with third quarter nominal GDP growth slowing to 6.2 percent before the deflator adjusted real growth to 6.9 percent. The nominal figure was lower than the first and second quarter, signaling that even if China is still growing at a healthy rate, deflation is becoming a bigger problem for companies in the resource and industrial sectors.
WisdomTree Chinese Yuan (CYB)
WisdomTree Bloomberg USD Bullish (USDU)
CurrencyShares Euro Trust (FXE)
CurrencyShares Japanese Yen (FXY)
CurrencyShares Australian Dollar (FXA)
CurrencyShares Canadian Dollar (FXC)
WisdomTree Emerging Market Currency (CEW)
WisdomTree Commodity Currency (CCX)
PowerShares DB U.S. Dollar Bullish Index (UUP)
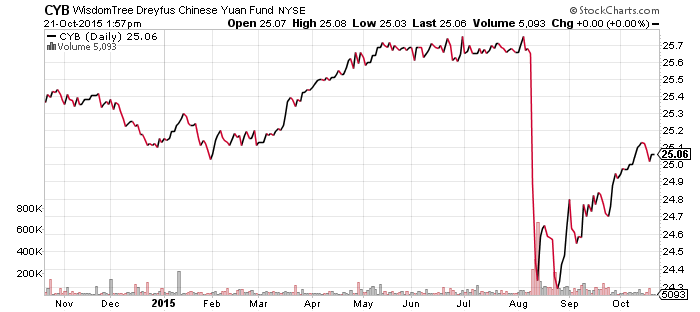
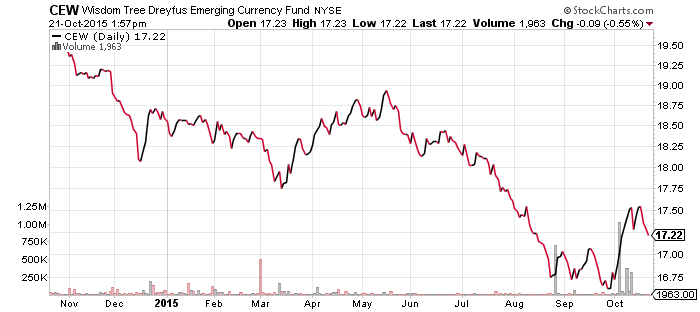
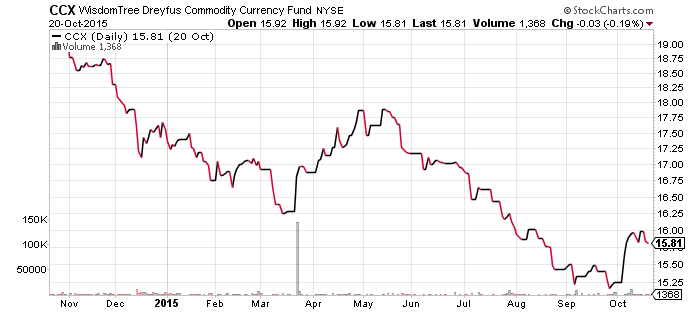
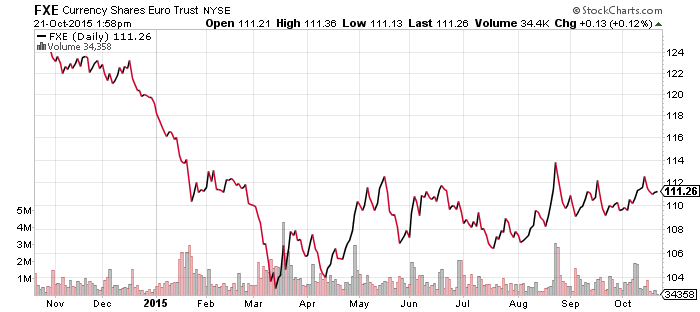
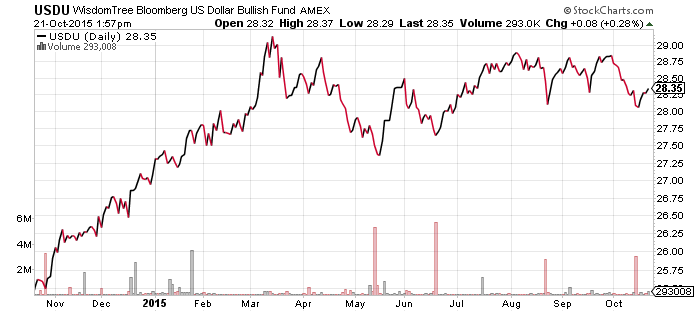
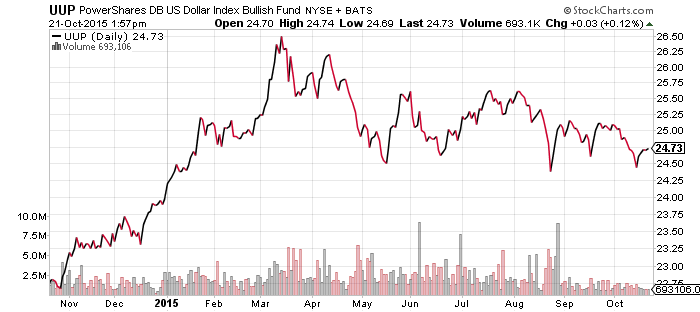
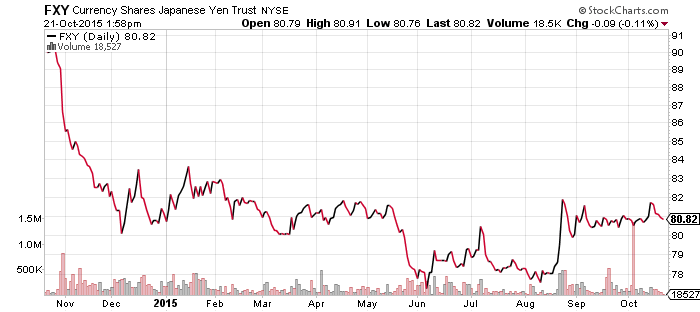
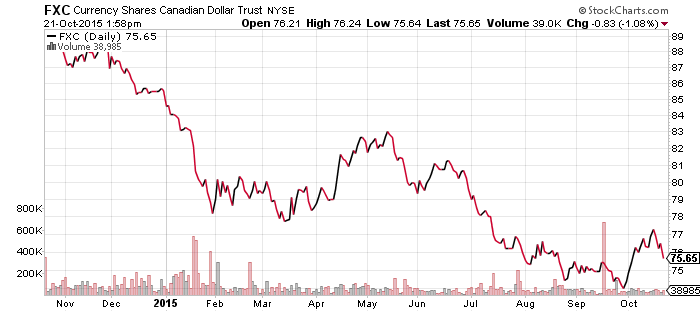
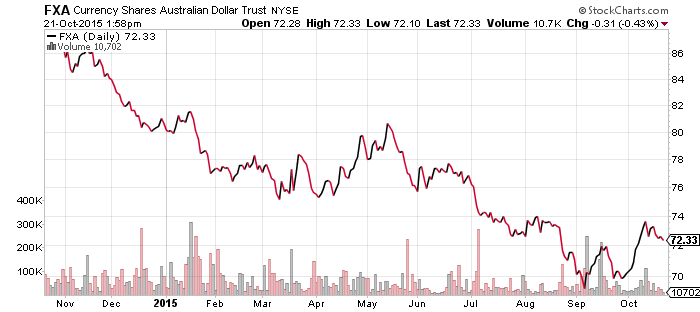
Both of the U.S. dollar indexes, USDU and UUP, have been relatively low, but neither collapsed further over the past week. The euro remains in an uptrend, while Canadian and Australian dollars, as well as emerging market currencies, are displaying a trend similar to that of emerging markets. The Chinese yuan, which may be added to the IMF’s SDR currency basket in November, may be responsible for those patterns. Economic frailty could ultimately lead to a weakening of the yuan, but the government may try to prop up the currency until the vote occurs. The U.S. Treasury softened its position on the yuan this week, saying it is below its appropriate valuation, rather than calling it significantly undervalued as they have previously stated.
SPDR Energy (XLE)
FirstTrust ISE Revere Natural Gas (FCG)
Global X Copper Miners (COPX)
Market Vectors Coal (KOL)
Market Vectors Steel (SLX)
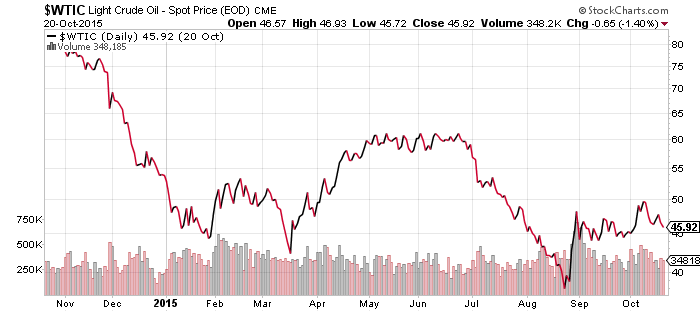
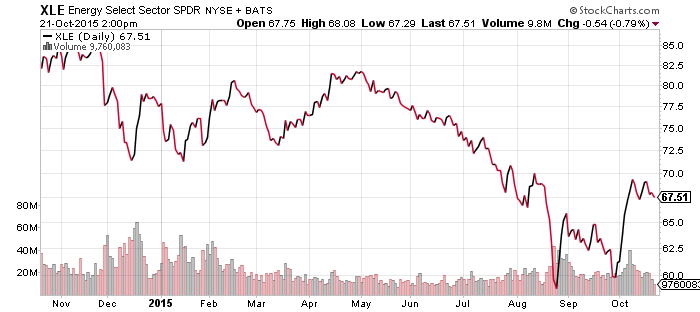
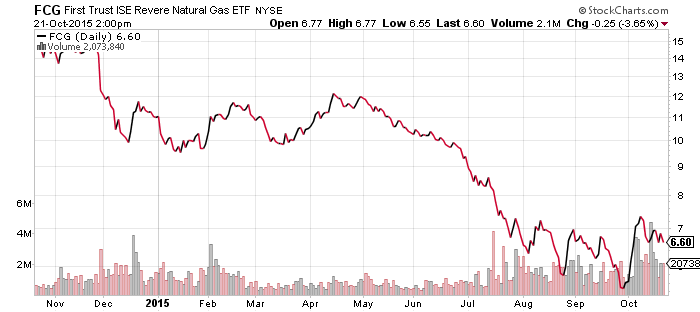
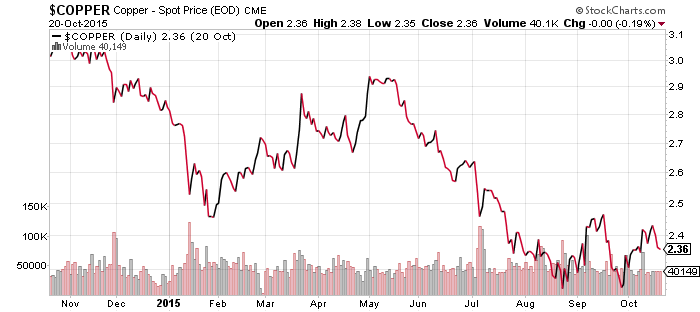
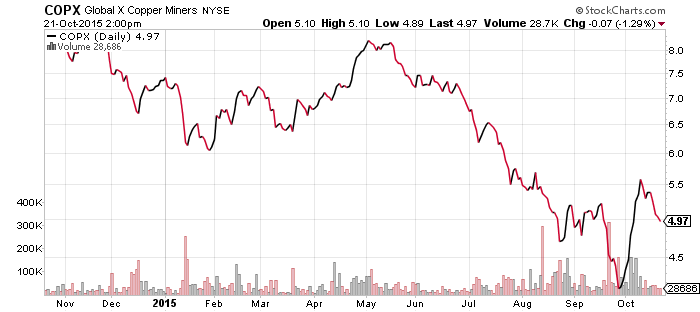
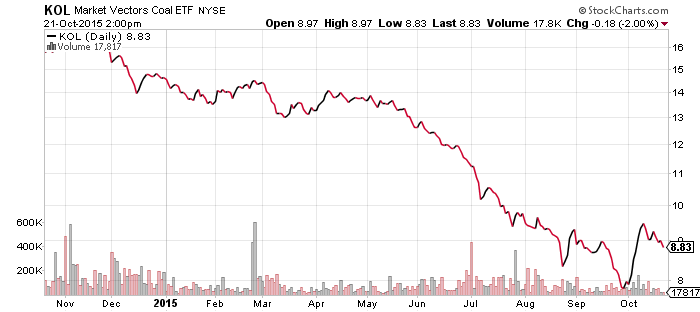
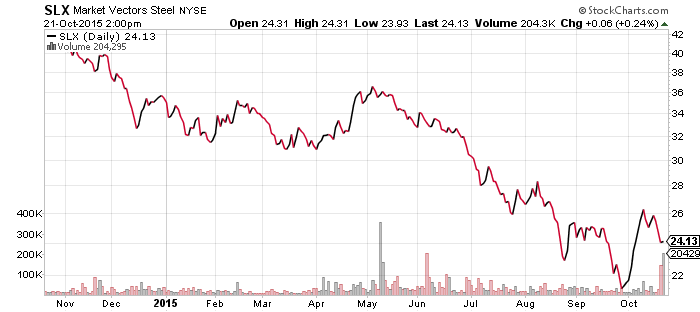
Similar to both emerging market currencies and equities, commodities are testing the gains achieved during the recent rally. Shares of resource producers moved up with the prices of oil, copper and other industrial commodities. The key level is $44 for oil. A break below that would increase the probability that the lows will be tested.
iShares iBoxx High Yield Corporate Bond (HYG)
iShares iBoxx Investment Grade Corporate Bond (LQD)
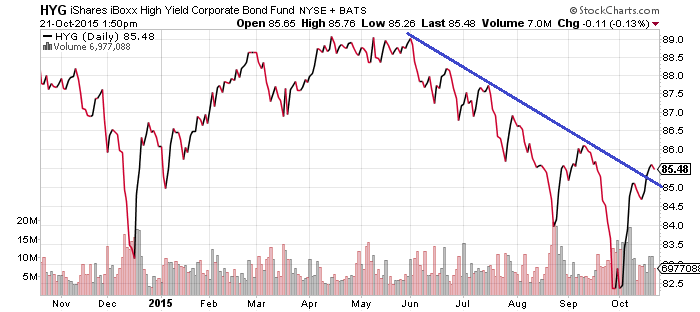
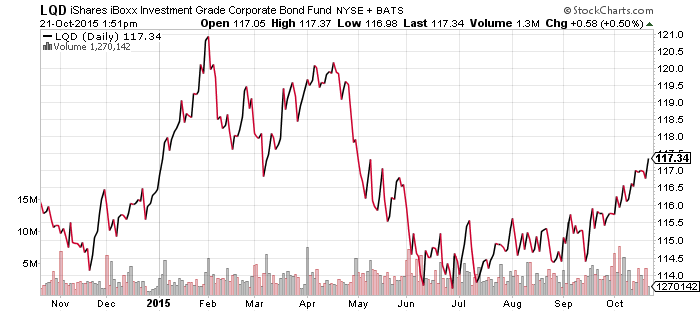
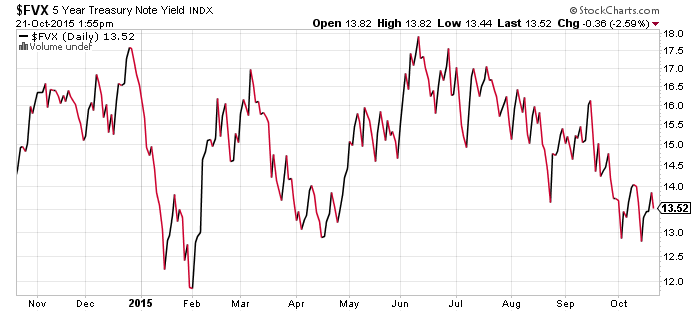
HYG broke a downtrend over the past week, which had been in place since the beginning of June. HYG’s ability to hold above its trend line will be vital moving forward. The chart of LQD and the 5-year Treasury yield illustrate that falling interest rates are working in HYG’s favor, but oil prices could be problematic.
iShares US Home Construction (ITB)
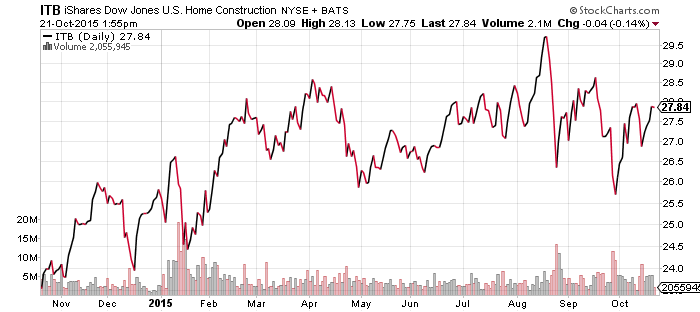
This week has been generally light on economic data. However, homebuilder sentiment climbed to a 10-year high this month, while September’s housing starts were the highest in nearly 8 years.
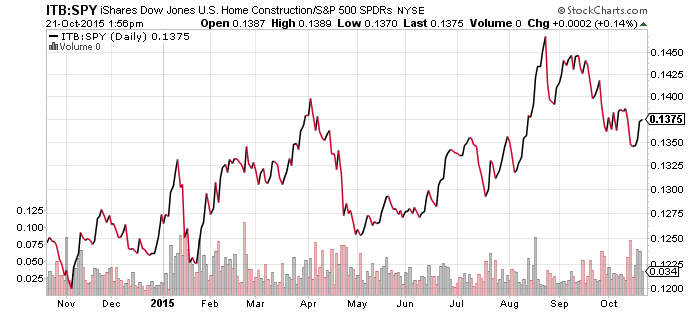
The data helped homebuilders bounce back to the top of their recent trading range. The second chart reflects the price ratio of ITB to SPDR S&P 500 (SPY). ITB underperformed the broader market since its August peak, but has remained in an uptrend since May. This latest news could be the push that sends the sector back into a positive trend over the days and weeks ahead.
SPDR Utilities (XLU)
SPDR Pharmaceuticals (XPH)
SPDR Materials (XLB)
SPDR Consumer Staples (XLP)
SPDR Consumer Discretionary (XLY)
SPDR Healthcare (XLV)
SPDR Technology (XLK)
SPDR Financials (XLF)
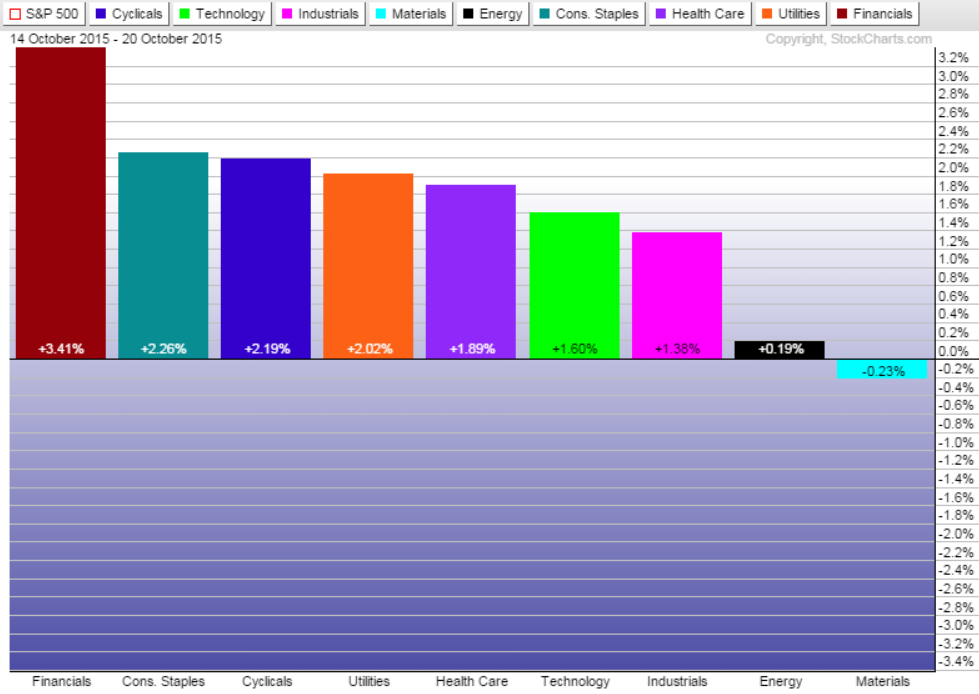
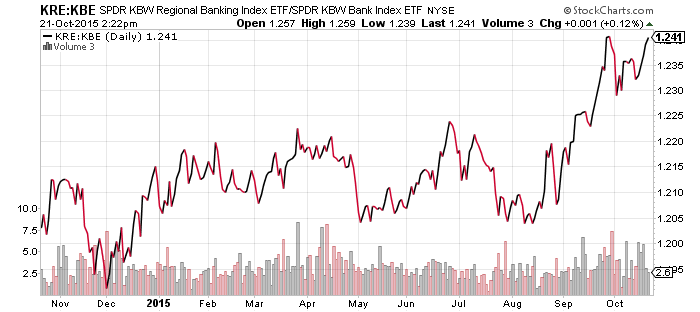
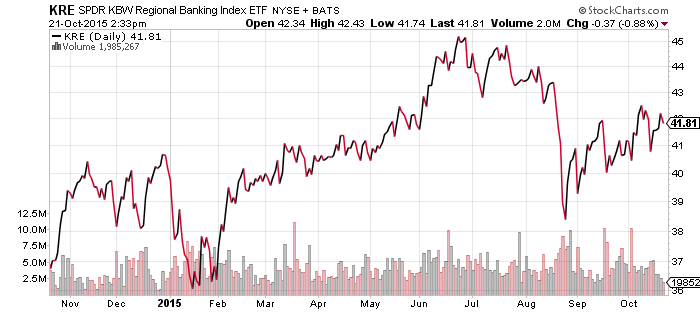
The financial sector was the best performer over the past week, despite falling interest rates. Some of the big banks missed earnings or warned on revenue. The big banks that issued warnings have had significant exposure to financial markets, either through client trading or trading on their own accounts. Regional banks are not similarly exposed. The relative price chart of regional banks versus their larger counterparts, illustrated by the comparison of KRE versus KBE, pushed closer to its relative high this year.
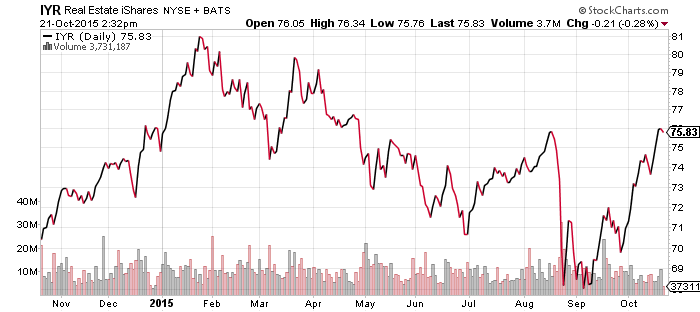
Both real estate and utilities continued their rallies due to falling interest rates.
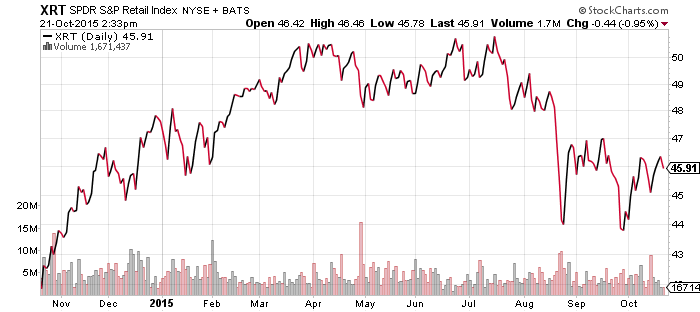
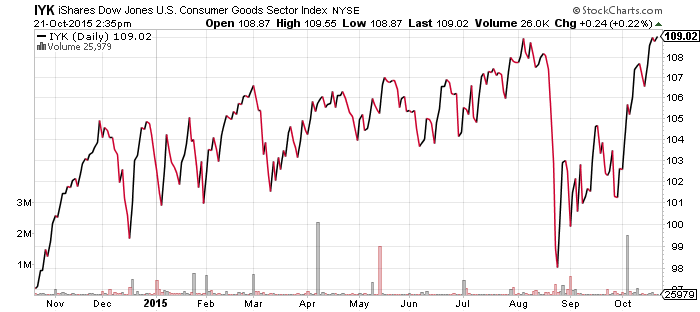
Although Wal-Mart (WMT) disappointed with its earnings last week, retail ETF XRT has held up well thanks to its diversification. The consumer staples ETF from iShares, IYK, is at a new 52-week high.
SPDR Gold Shares (GLD)
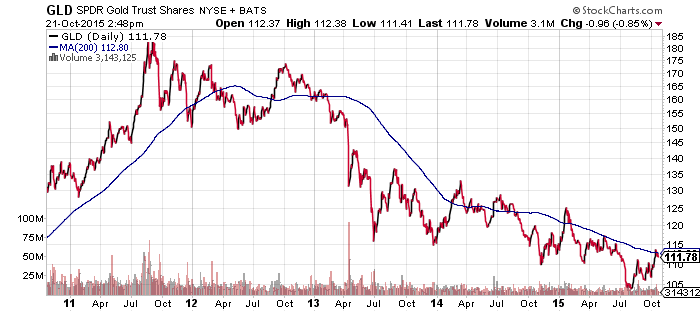
Gold outperformed other commodities in recent weeks, though it has recently begun to slip along with oil and other assets. Gold has spent 4 years in a bear market, but has performed better in 2015 thanks to European quantitative easing and China’s decision to devalue the yuan. If currency markets remain calm, gold may struggle. The metal has also hit its 200-day moving average, which provides some resistance as it failed to sustain a move above this level three times over the past two years.
