db X-Trackers Harvest CSI 300 China A-Shares (ASHR)
China is the market to watch this week and likely for the next few months. The Chinese economy is again reaching a turning point as the leadership tries to deflate the credit bubble without popping it. Real estate prices started falling in one city, resulting in a mini-panic by the Chinese press. The nation is clearly on edge, with shadow banking trust defaults a looming concern adding to fears of a real estate slowdown. On the positive side, when real estate developers slashed their prices in the city of Hangzhou, inventory sold out and they had to turn away customers offering to pay 100 percent cash. The issue is whether there are enough buyers to halt a slide in prices.
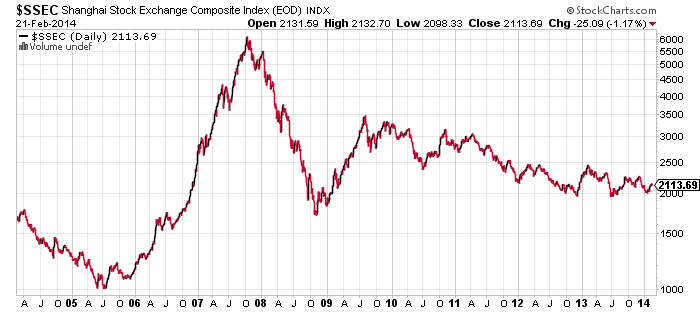
This 10 year chart of the Chinese mainland stock market shows a big reason why emerging markets have trailed developed markets over the past three years. The area around the 2000 level is a strong area of support for the market, with the Shanghai Composite making a triple bottom. On the other hand, the fundamentals remain weak. A test of the support level may come in the near future given the volatility we’ve seen recently.
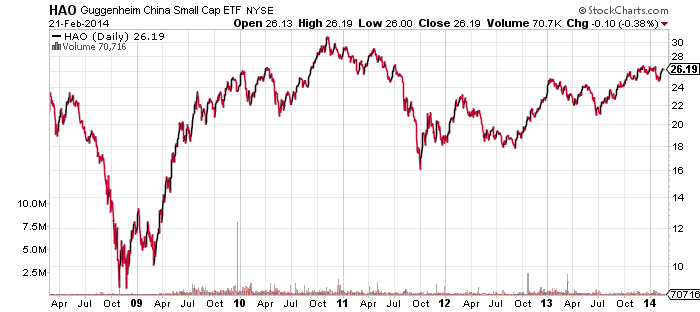
Guggenheim China Small Cap (HAO)
Not all China ETFs have done as poorly as the A-shares. As this chart of HAO shows, small caps, with their weighting tilted towards consumer companies have held up much better. HAO is actually closer to a breakout than a breakdown, though it has been in a trading range since 2009. This does mean there is more downside risk if China slides though. A loss of 30 percent would only move HAO to the lower end of its trading range and not even represent a significant breakdown for the ETF.
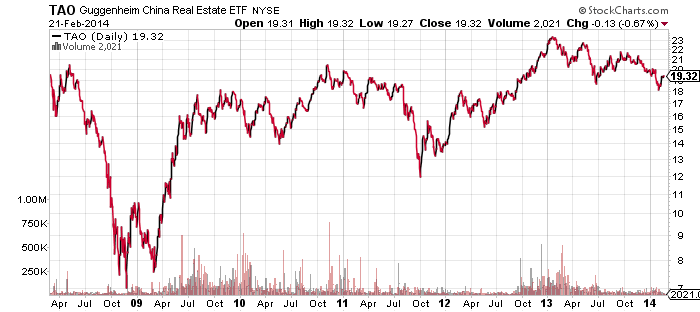
Guggenheim China Real Estate (TAO)
As for real estate in China, it broke out in early 2013, as did the mainland stock market. The gain though, was quickly lost. TAO is back at the high end of its post-2009 trading range as well. Like HAO, it is closer to its highs than its lows and losses of about 30 percent are possible if sentiment turns bearish on China.
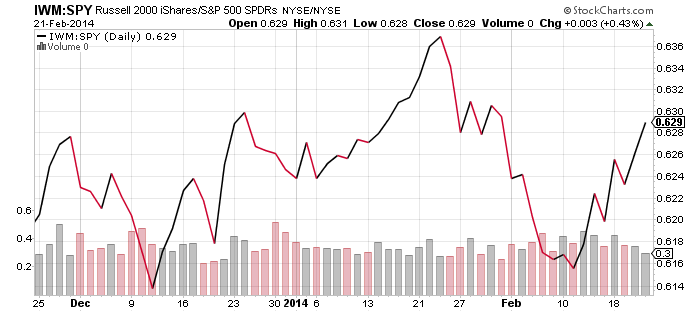
iShares Russell 2000 Index (IWM)
Last week we were looking for IWM to close a gap on the chart and see how it performed as it approached important trendlines. IWM did close the gap and moved higher for the week. As this chart comparing IWM and SPDR S&P 500 (SPY) shows, the small caps continue to outperform the broader market. Even though the S&P 500 Index was flat last week, the strength in small caps is a bullish sign. That said, the small caps still need to push higher before they’re seen as making a bullish breakout. It wouldn’t take much of a drop to put them back below the long-term trendline that stretches back to March 2000.
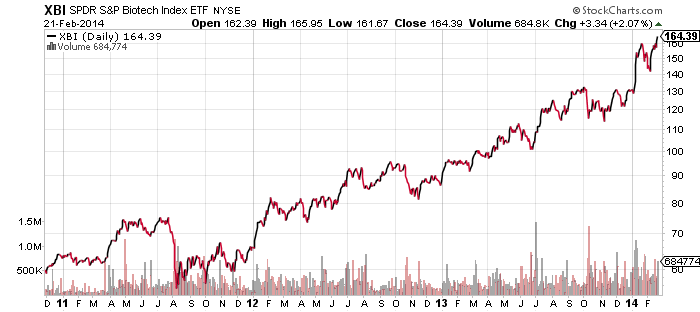
SPDR S&P Biotechnology (XBI)
At some point, biotechnology stocks are going to take a breather, but when is unknown. As this chart of XBI shows, shares have not only reached new highs recently, but biotechnology stocks still have momentum behind them. This sector has enjoyed as large a run similar to junior gold mining shares. However, unlike mining shares that fell consistently for more than 2 years, biotechnology has been a top performing sector over the same period. We would not be adding shares at these levels and you may want to consider paring back some if a position has grown into a large portfolio holding.
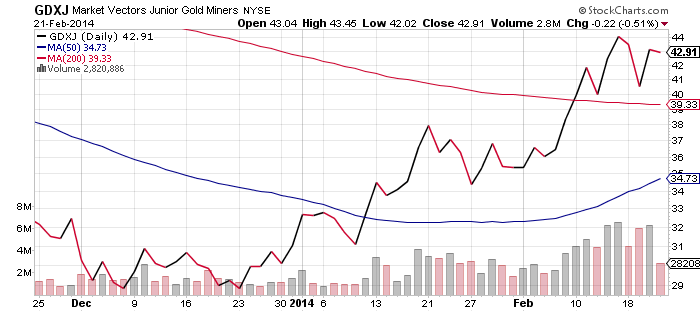
Market Vectors Junior Gold Miners (GDXJ)
A quick note on the gold mining shares: Shares hit a new high for the year last week but the move is running out of steam in the short-run. A pull back over the coming week or two would not be surprising, with a move as low as $36 possible. The 200-day moving average on GDXJ is $39.33 and the 50-day MA is $34.73, but rising quickly. Unless shares sell-off beyond the $36 level, a bullish cross is likely in the next month. Except for a brief blip in 2013, GDXJ’s 50-day MA has not traded above its 200-day MA since July 2011.
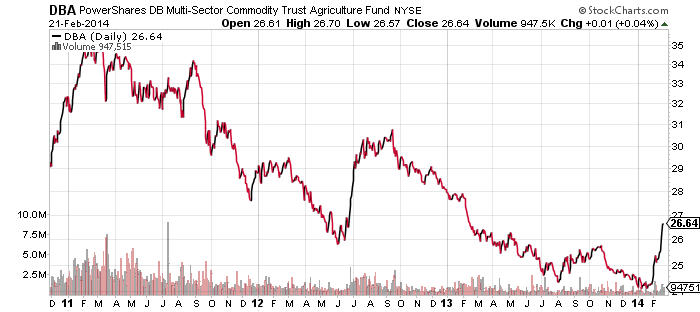
PowerShares DB Agriculture (DBA)
Agricultural commodities have enjoyed a breakout this year. Whether it can hold up may be decided by China. A stronger global economy can support higher commodity prices, but if the global economy weakens, the general move higher in prices may be snuffed out before it finds its legs. Here investors are looking towards copper for a signal; it remains weak, but is typically the leading indicator for commodities. If copper picks up, the move in agricultural commodities may have legs. Otherwise, these gains may soon be lost.