SPDR Energy (XLE)
United States Natural Gas (UNG)
First Trust ISE Revere Natural Gas (FCG)
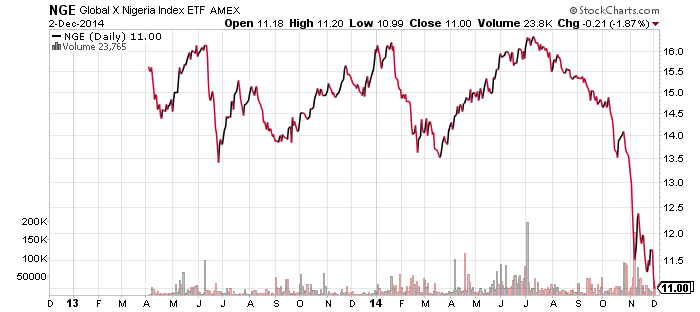
Global X Nigeria (NGE)
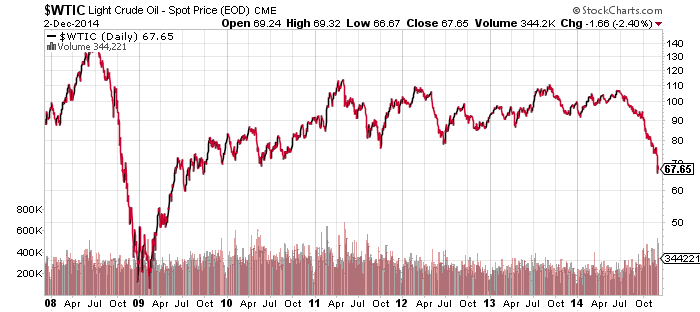
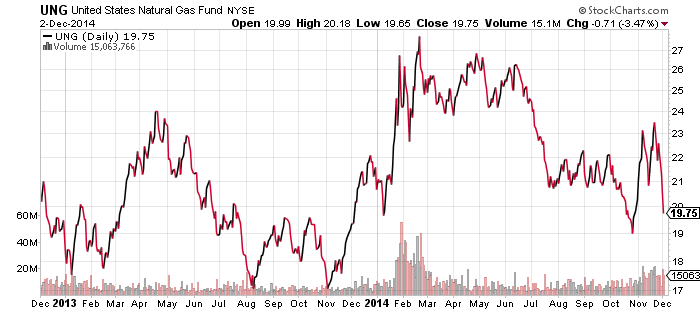
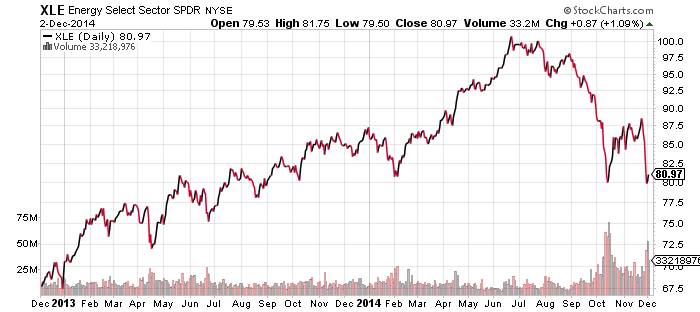
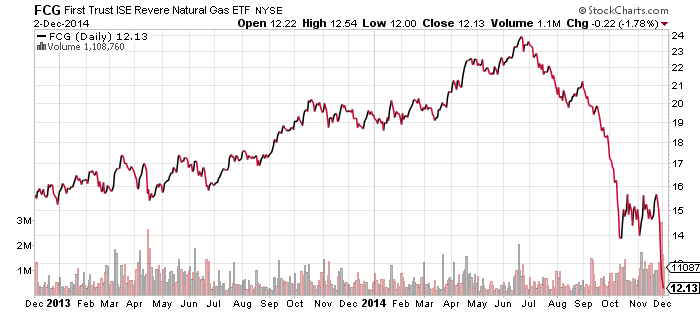
Last week we focused on energy ahead of the OPEC meeting on Thanksgiving. The group decided to leave oil production level and oil prices plunged. The damage can be seen in the charts below, but the one to focus on is SPDR Energy (XLE). The fund dropped to its lows for the year, but didn’t break support. That’s one of the best looking charts among energy funds, where many have broken to new lows, including natural gas equities. XLE may be able to hold these levels, but the odds favor the energy bears right now, and a further drop is likely.
iShares iBoxx High Yield Corporate Bond (HYG)
iShares JPMorgan USD Emerging Markets Bond (EMB)
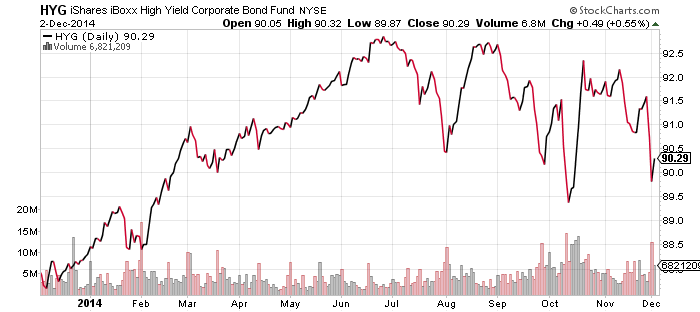
High yield bonds peaked in late June and have been consolidating since. A bottom may have been made in October, but the sector has continued to struggle. Last week’s OPEC meeting stung the sector because some shale oil and gas producers have funded operations with high yield debt. Even though many larger producers have hedged production or have low operating costs, smaller producers that relied heavily on debt could run into trouble.
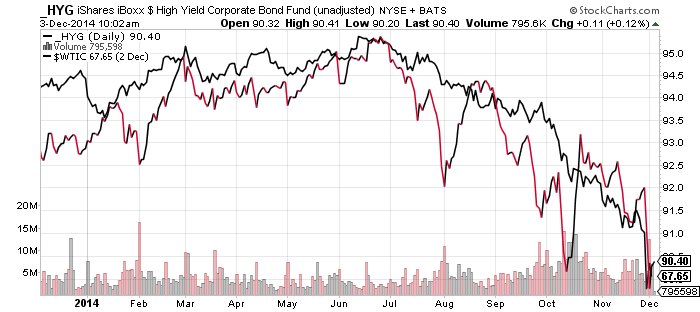
The second chart below is HYG with dividends removed, along with the price of West Texas Intermediate Crude in black. As can been seen, high-yield is tracking quite closely with oil prices.
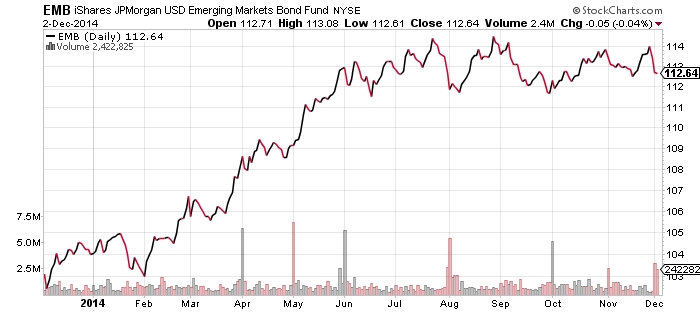
Investors are also concerned about Venezuela’s ability to repay its U.S. dollar debt. Venezuela recently received a $4 billion loan from China and it burned through one-third of it in a week, and that happened before the recent drop in oil prices. The country may find a way to avoid a crisis, but if it continues on its current trajectory, it will look increasingly dire. Some emerging market bond funds, such as EMB at 2.5 percent, have small exposure to Venezuelan debt.
PowerShares U.S. Dollar Index Bullish Fund (UUP)
CurrencyShares Euro Trust (FXE)
CurrencyShares Japanese Yen (FXY)
WisdomTree Dreyfus Chinese Yuan (CYB)
WisdomTree Dreyfus Emerging Currency (CEW)
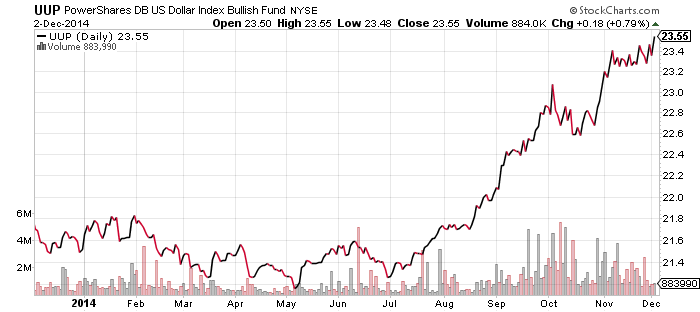
The U.S. dollar is one of the strongest assets in the world at the moment. The U.S. Dollar Index is in an uptrend and even short-term technical indicators do not show the index is overbought. Instead, a new breakout appears to be underway after a one-month consolidation phase.
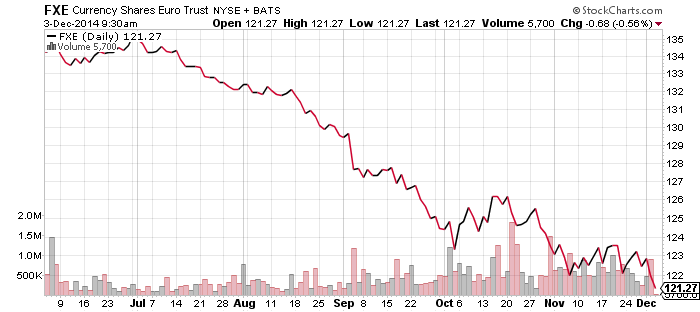
By far the largest component of the U.S. Dollar Index is the euro, and as the chart of FXE shows below, a one-month consolidation is over and the euro is sinking again. Speculators are betting the European Central Bank will increase its interventionist policies at tomorrow’s meeting.
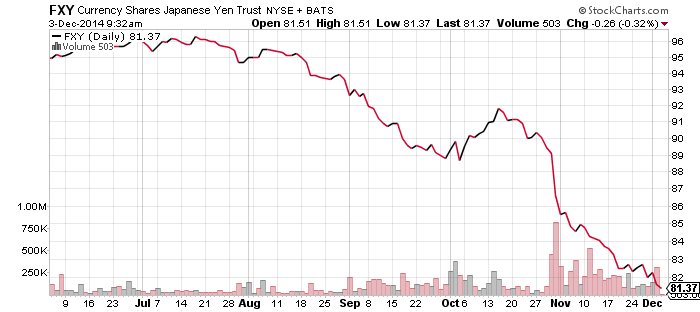
The second largest component of the U.S. Dollar Index is the yen, and it is trading at new lows for the year as well.
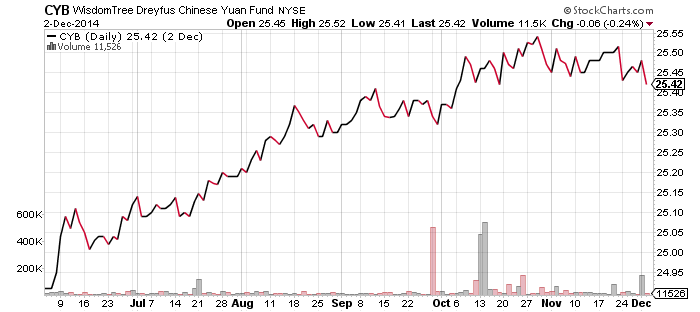
Another less followed index is the Asian Dollar Index. Its largest component being the Chinese yuan but excludes the yen. Since Japan’s Halloween surprise increase of quantitative easing, China’s yuan has been weakening versus the U.S. dollar, helped along recently by interest rate cuts in China.
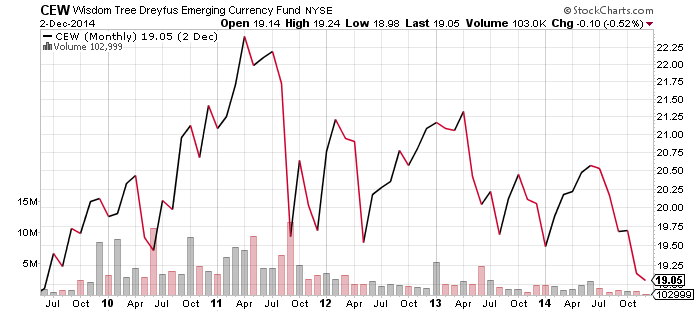
Finally, there’s the emerging market currency ETF, CEW. This fund is also trading near its all-time lows, which stretch back to its inception in late 2009.
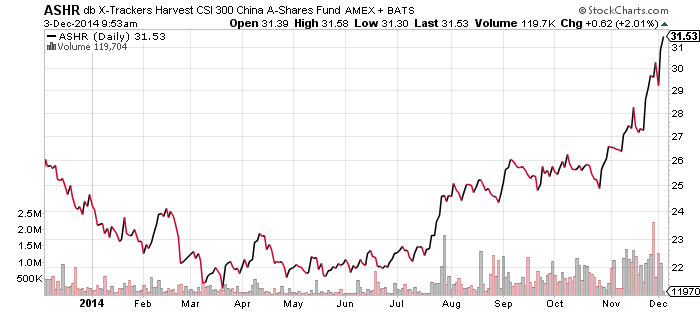
db X-Trackers Harvest CSI 300 A-Shares (ASHR)
Chinese investors are still turning to stocks as the property market remains unattractive. Unlike the U.S. dollar, however, the Chinese market does look extended and overbought at the moment. The economy is still slowing, so there’s any number of possible negative events that could rattle investors and trigger a pullback. Taking a long-term perspective, however, shares are still at historically inexpensive levels.
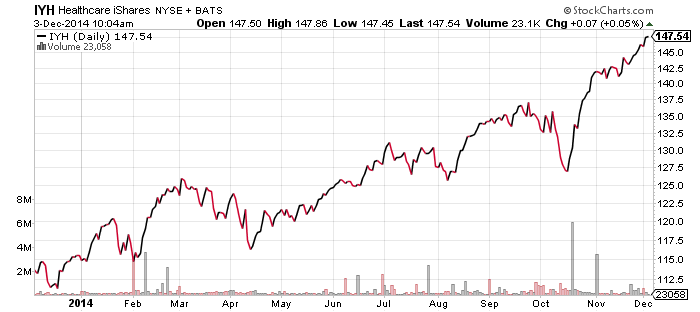
iShares U.S. Healthcare (IYH)
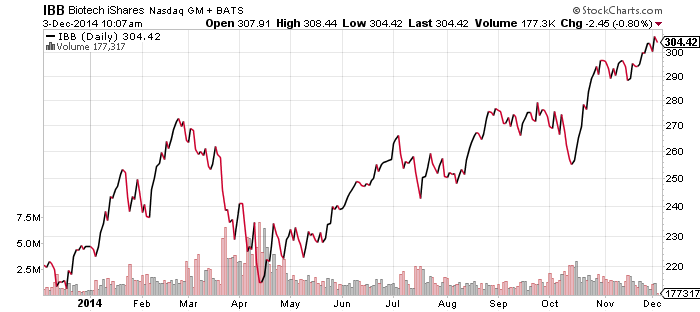
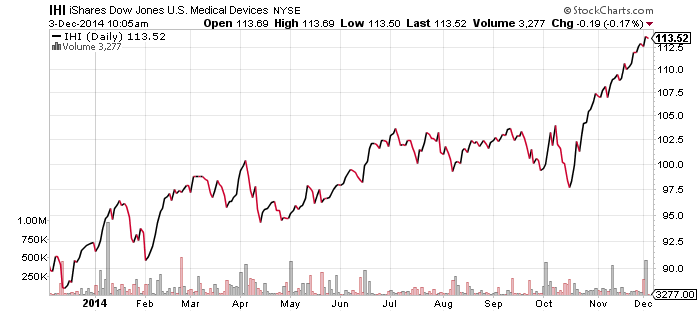
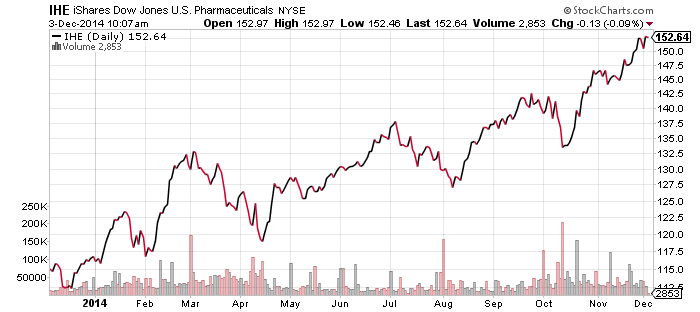
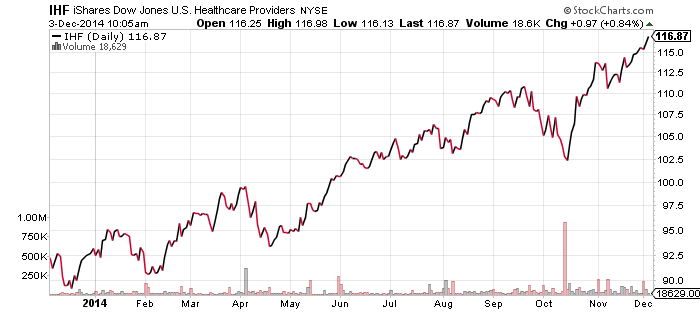
Healthcare stocks are continuing to move the market higher. Each of the major subsectors moved to new highs in the past week, including pharmaceuticals, biotechnology, medical devices and healthcare providers. This broad rally indicates the sector will be difficult to dislodge from its leadership position.
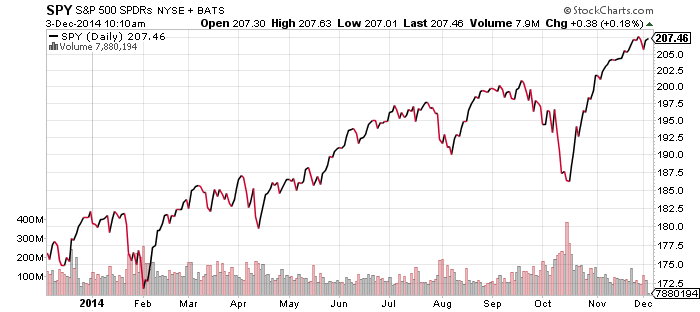
SPDR S&P 500 (SPY)
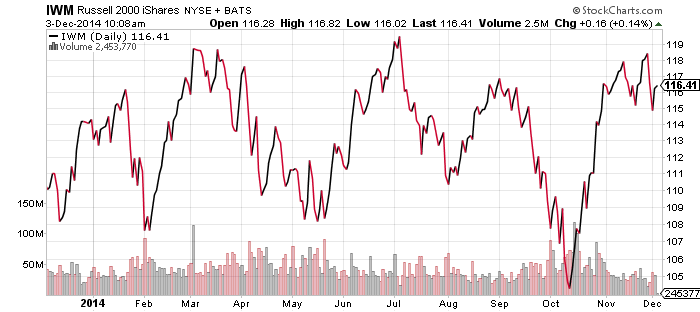
iShares Russell 2000 (IWM)
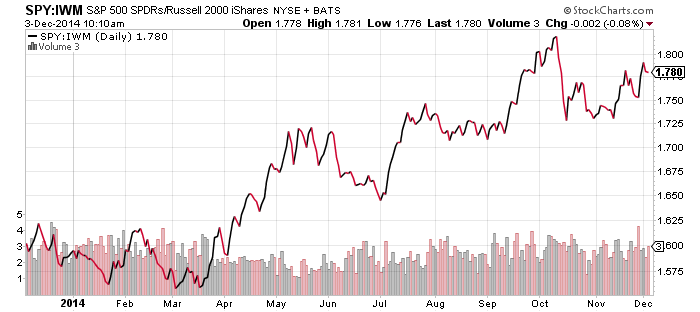
The Russell 2000 Index of small cap stocks is still struggling to break out of a trading range, even though the S&P 500 Index continues to set new highs. The last chart below is a price ratio of SPY to IWM, showing how large caps have been outperforming small caps since March. Since the major indexes are at new highs, a rally by small caps is becoming increasingly likely than not.
